Data Stories
Data Set 1

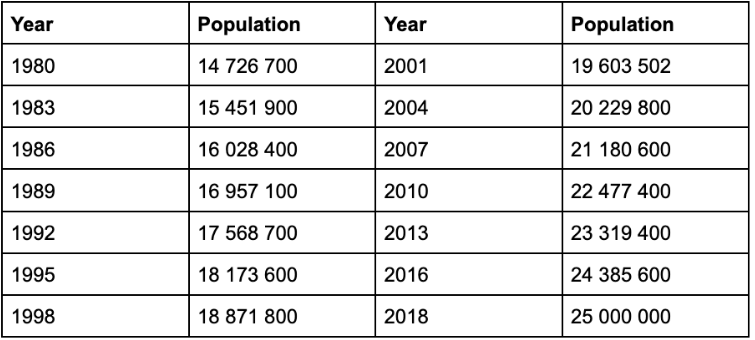
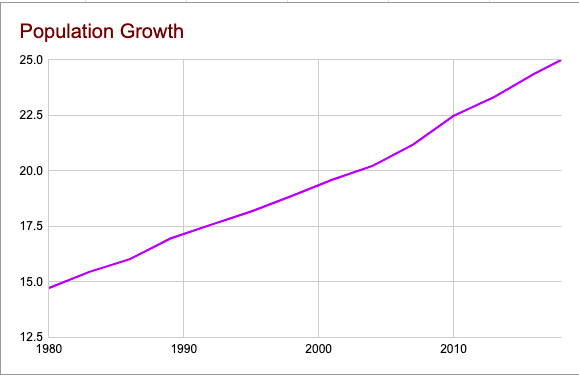
This table made into a graph ------------------------------------>


Data Set 2
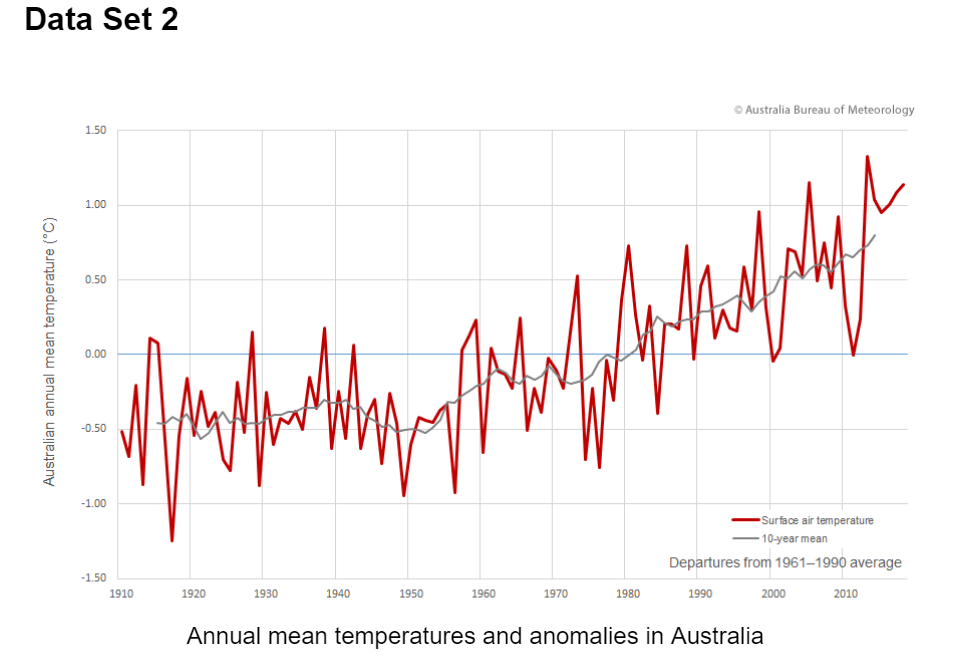
Write a paragraph using the PQE model to identify the features of the data in thegraph 'Annual mean temperatures and anomalies 1910-2010'.
The graph's average annual mean temperature remains constant from 1910 to 1950, and steadily inclines till 2010. The surface air temperatures remain within a one degrees celsius range in regards to the 10-year mean. The recorded temperatures range from -1.30 degrees celsius to around 1.30 degrees celsius over the century. Unless the constant temperature from 1910 to 1950 is included, there are no particular outliers that break this pattern. The one temperature that records the furthest from its 10-year mean is the temperature in around 1917, deviating by about 0.70 degrees celsius.
Data Set 3
Description
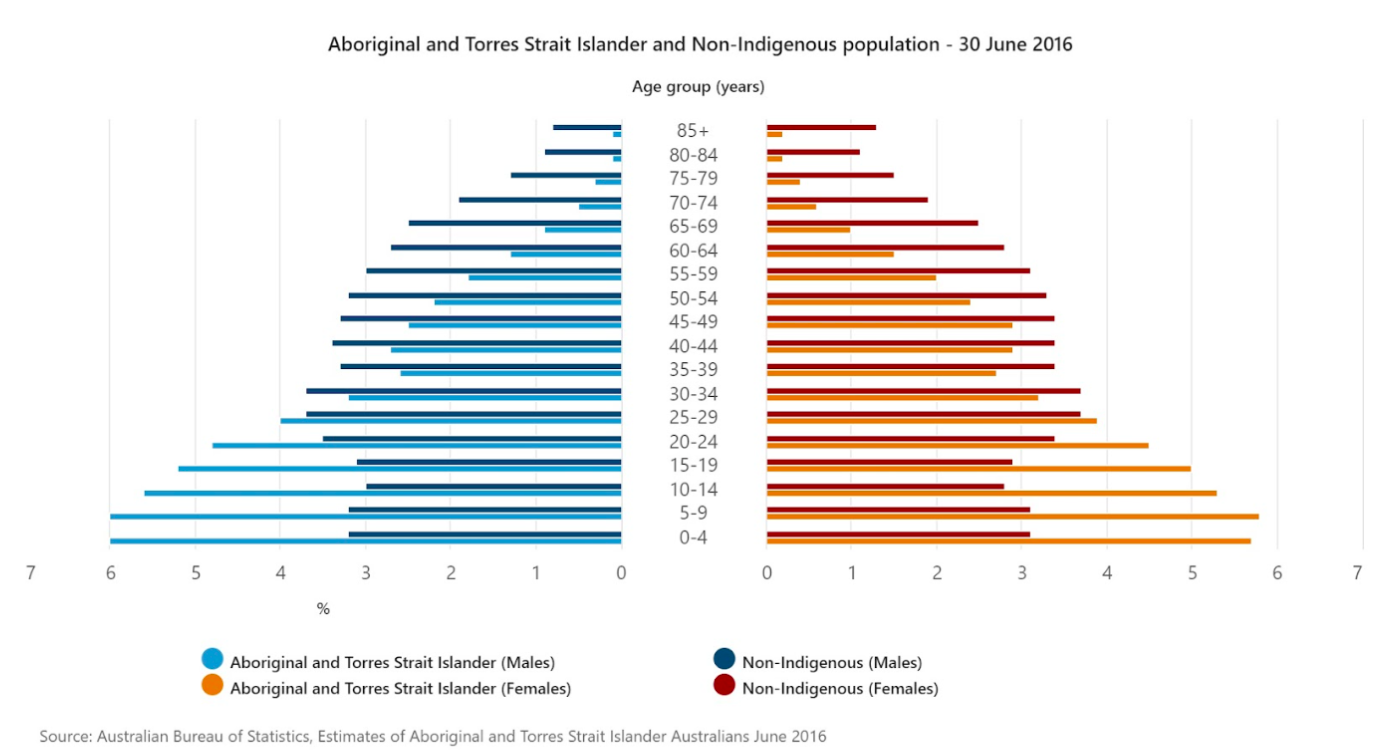
The following data in this Pyramid Graph compares the Aboriginal and Torres Strait Islander population and the Non-Indigenous population. The graph remains a pyramid, but crosses over each other, with the Non-Indigenous populations outweighing the Aboriginal population as the age cohorts get older. It is almost symmetrical, in both males and females. The number of Aboriginal males and females aged 0-29 exceeds the number of Non-Indigenous males and females. The highest percentage of Aboriginals is within the 0-5 and 0-9 of male age group, with both recording about 6% each. It is only until the 30+ age group, where the number of Non-indigenous people exceeds the number of Aboriginal people. The highest percentage of Non-Indigenous people is within the 25-29 and 30-34 age group in both genders, however, in this case, the percentage difference between Indigenous and Non-Indigenous is marginal. As the age cohorts get older, the Non-Indigenous population becomes greater than that of the Aboriginal population, with female numbers slightly higher than males. The oldest population percentage is 1.3% in the 85+ female age group. Overall, the Aboriginal population has a steep decline as the cohorts get older, whilst the Non-Indigenous population remains quite constant, with only a slight decline.

Explain and Discuss
This criss-cross could either demonstrate that Aboriginal groups have a shorter life span, or could be a result of the stolen generations or other events in Australian history. The sudden increase of Aboriginal children could be justified by the laws and regulations that support Indigenous people, allowing them to have children without the fear of having to lose them or have them killed. The steep decrease in Aboriginal populations as compared to the Non-Indigenous could unfortunately be due to the lack of resources they receive in order to sustain a healthy life.